
Qualys Threat Research Unit 2025
The Broken Physics
of Remediation
of Remediation
Based on 1 billion+ CISA KEV remediation records across 10,000+
organizations (2022-2025). The math no longer works in the defender’s favor.
organizations (2022-2025). The math no longer works in the defender’s favor.
The future of risk management is autonomous

The Core Asymmetry
Attackers move in hours. Defenders move in weeks.
The average Time-to-Exploit has collapsed to negative one day — meaning weaponization happens before patches even exist. Meanwhile the average defender takes 21 days to remediate a critical vulnerability. This gap is not a process problem. It is a physics problem.

Avg Time-to-Exploit
-1 day
Days exploits arrive before patches do.
Defender Avg Window
21 days
Days to close a critical vulnerability.
Defenders Lose
88%
Of weaponized CVEs patched slower than exploited.
Still Open at Day 7
63%
Critical KEV vulns in 2025 — up from 56% in 2022.
Volume Explosion
6.5x more events.
No improvement in coverage.
Vulnerability events closed per year grew from 73 million to 2022 in 473 million in 2025. Teams worked harder and closed more tickets — yet the percentage of critical exposures still open at Day 7 got worse.

CISA KEV events closed per year (across 10,000+ orgs)
2022
73M
Baseline
2023
123M
+1.7x
2024
301M
+4.1x
2025
473M
+6.5x
2022
73M
Baseline
2023
123M
+1.7x
2024
301M
+4.1x
2025
473M
+6.5x
The Human Ceiling
You cannot scale a workforce 6.5x to match 6.5x more risk.
Even controlling for volume growth, the percentage of critical CISA KEV vulnerabilities still open at Day 7 worsened from 56% to 63%. The constraint is not effort — it is the operational model itself.

Open at Day 7 — 2022
56%
Of critical KEV vulnerabilities still unpatched
Open at Day 7 — 2025
63%
Worse despite 6.5x more events closed
The Zero-Day Zone
Half of high-profile CVEs were weaponized before disclosure.
Of 52 high-profile CVEs with complete exploitation timelines, 26 had negative TTE — exploitation happened before the CVE was publicly disclosed. Three more were weaponized on the same day. “Day 0” is not the beginning of the race. It is the point at which defenders discover they are already behind.
Days between disclosure and first exploitation (selected high-profile CVEs)
Win Kernel EoP (CVE-2024-21338)
-182 days before disclosure
Exploited nearly 6 months before anyone knew it existed
WinRAR RCE (CVE-2023-38831)
-110 days before disclosure
Avg remediation: 140 days after patch availability
ProxyNotShell (CVE-2022-41040)
-85 days before disclosure
Exploited 85 days before advisory; months to remediate
Cisco IOS XE
-30 days before disclosure • avg remediation: 263 days
Head start measured in days; defender response in months
ActiveMQ RCE
-15 days before disclosure • avg remediation: 459 days
Over 15 months average to close pre-disclosure vulnerability
WebLogic RCE (CVE-2023-21839)
+71 days TTE • avg remediation: 242 days
Defenders had a 2-month head start and still lost. Exploited by
Water Sigbin and Prophet Spider.
Water Sigbin and Prophet Spider.
Win Kernel EoP
(CVE-2024-21338)
(CVE-2024-21338)
-182 days before disclosure
Exploited nearly 6 months before
anyone knew it existed
anyone knew it existed
WinRAR RCE
(CVE-2023-38831)
(CVE-2023-38831)
-110 days before disclosure
Avg remediation: 140 days after patch
availability
availability
ProxyNotShell
(CVE-2022-41040)
(CVE-2022-41040)
-85 days before disclosure
Exploited 85 days before advisory;
months to remediate
months to remediate
Cisco IOS XE
-30 days before disclosure
• avg remediation: 263 days
• avg remediation: 263 days
Head start measured in days;
defender response in months
defender response in months
ActiveMQ RCE
-15 days before disclosure
• avg remediation: 459 days
• avg remediation: 459 days
Over 15 months average to close pre-
disclosure vulnerability
disclosure vulnerability
WebLogic RCE
(CVE-2023-21839)
(CVE-2023-21839)
+71 days TTE
• avg remediation: 242 days
• avg remediation: 242 days
Defenders had a 2-month head start
and still lost. Exploited by Water
Sigbin and Prophet Spider.
and still lost. Exploited by Water
Sigbin and Prophet Spider.
The Manual Tax
The long tail is not a few outliers. It is the majority of your risk.
The gap between median and average remediation time reveals a consistent multiplier effect. The slowest half of assets take 4–5x longer to remediate than the fastest. This is where forgotten servers, remote laptops, and shadow IT live.
Median vs. average days to close — manual tax multiplier
Spring4Shell
266 Days
WebLogic RCE
242 Days
F5 BIG-IP
188 Days
Veeam Creds
196 Days
Spring4Shell
266 Days
WebLogic RCE
242 Days
F5 BIG-IP
188 Days
Veeam Creds
196 Days

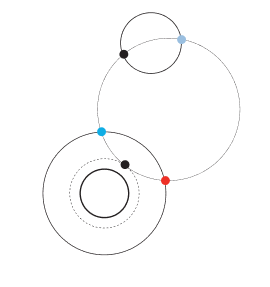
Risk Mass — Follina Case Study
A single CVE.
33,000 exposure-days.
Risk Mass = vulnerable assets x days exposed. It captures what MTTR ignores: cumulative exposure across the entire remediation lifecycle. Follina (CVE-2022-30190) was exploited by nation-state actors weeks before disclosure and by ransomware groups months after the patch. Three distinct failure phases, each with its own adversary tier.

Blind Spot
Day -30 to Day 0
~12,000 Exposure-Days36% of Total Risk Mass
All 400 assets vulnerable. No patch existed. Chinese-affiliated APT actors (TA413) already exploiting. No remediation ticket could exist — the threat was invisible.
Sprint
Day 0 to Day 23
~6,200 Exposure-Days 19% of Total Risk Mass
Patch released. Remediation begins. By Day 7: 79% still unpatched. By Day 14: 57%. By Day 23 (halfway point): 42% still exposed. This is the phase that looks good on executive dashboards.
Long Tail
Day 23 to Day 364+
~14,600 Exposure-Days 44% of Total Risk Mass
Commodity ransomware operators (CI0p, LockBit 3.0, BI00dy) adopted the exploit. At Day 55 (avg close): 90 assets still open. At one year: 15 assets still exposed to a CVE nation-state actors had weaponized 13 months prior.
The dashboard measures Sprint (19%). Risk Mass measures everything it misses — the Blind Spot + Long Tail (81%).
The Sub-1% Reality
357 truly dangerous CVEs out of 48,172 disclosed in 2025.
Only 0.74% of all CVEs disclosed in 2025 were remotely exploitable, actively weaponized, and supported by working proof-of-concept code. Organizations burning cycles on the other 99.26% are wasting remediation resources on theoretical exposure.

Finding the needle: 357 weaponized CVEs in 48,172 disclosures — 2025



2022
131 / 25,043
0.52%
2023
185 / 28,816
0.64%
2024
218 / 39,964
0.55%
2025
357 / 48,172
0.74%
The Infrastructure Divide
Three asset classes.
Three completely different remediation realities.

Endpoints
<14 Days
Automated patching works. Extend with pre-disclosure detection.
Edge / Perimeter
Weeks
Internet-facing. Majority exploited before disclosure. Compensating controls essential.
Infrastructure
Months
Cisco IOS XE: 232 days median. F5 AuthBypass: 231 days. This is where the Manual Tax is heaviest.
The Path Forward
A Risk Operations Center closes the physics gap.
The scan-and-report model was built for an era of lower volume, longer exploit timelines, and acceptable human latency. That era is now over. A ROC is an end-to-end operational pipeline that executes the full remediation lifecycle at machine speed — not a dashboard, a team name, or a governance layer.

The three capabilities of an autonomous ROC
1
Embedded
Intelligence
Intelligence
Threat intel arrives as machine-readable decision logic, not a report to read. The system correlates CVEs against asset inventory, cross-references threat actor activity, and determines action priority in seconds.
2
Active Confirmation
(TruConfirm)
(TruConfirm)
Moves from version-based detection to exploit-based validation. Replaces “is this software vulnerable?” with “can this vulnerability actually be exploited right now?” Eliminates ghost risk from the remediation queue.
3
Autonomous
Action
Action
For confirmed risks, remediation must compress to match attacker speed. Policy-driven deployment on endpoints. Compensating controls (virtual patching, network containment, host isolation) for infrastructure. Humans govern the policies — they no longer execute every action.
Prioritization tells you what deserves attention. Confirmation tells you what deserves action.
Together, they are the complete pipeline.
Source: Qualys TRU — The Broken Physics of Remediation (2026) 1B+ CISA KEV records • 10,000+ orgs • 2022-2025



© 2026 Qualys, Inc. All rights reserved.
